Issue 2 | May 12 2020
The Pulse of the Aftermarket
A White Paper Series by Aftermarket Analytics and Full Throttle Technologies
Written by – Justin Holman PhD, CEO of Aftermarket Analytics
Introduction
Two weeks ago we released the inaugural issue of the Aftermarket Pulse, a new collaboration between Full Throttle Technologies, a provider of automotive Repair Order (RO) data and Aftermarket Analytics, a provider of cloud-based software services for demand forecasting and inventory management. In this second issue, we’re sharing updated national Repair Order (RO) data, through the week beginning April 26, and we’re looking closer at three of the hardest hit individual markets. In addition, we are delivering our first set of RO activity forecasts.
National Pulse
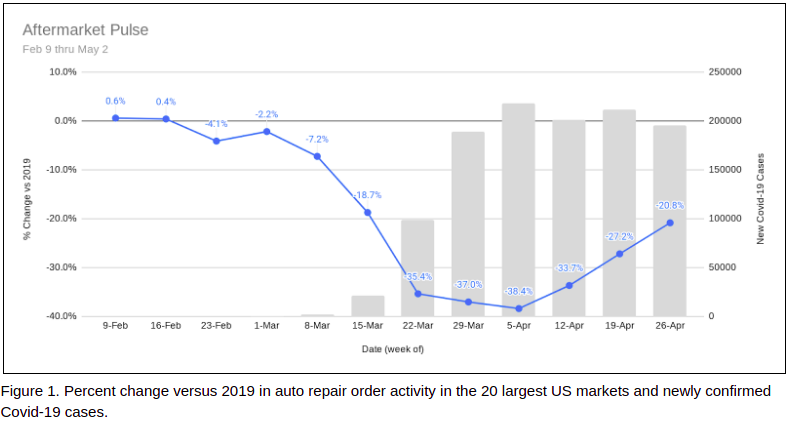
On a national level there are clear signs of increasing RO activity after bottoming in early April (see Figure 1). Perhaps this increase is related to protests against shelter in place orders or perhaps it reflects a public growing weary of staying home, especially as weather improves and States begin to ease restrictions on businesses. We may also be seeing pent up demand for deferred vehicle maintenance and repair. In any case, we are encouraged to see what appears to be the formation of a bottom and an upward trend.
Market Pulse
Individual markets show similar patterns with RO activity bottoming in early April in every market. While some markets have partially recovered, others remain down 30% to 40%. For most markets though, the RO data show a steady increase through the latter part of April. The number of new Covid-19 cases no longer seems to correlate with RO activity changes.
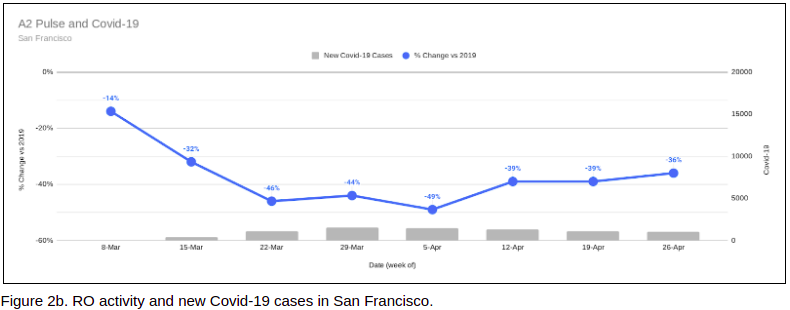
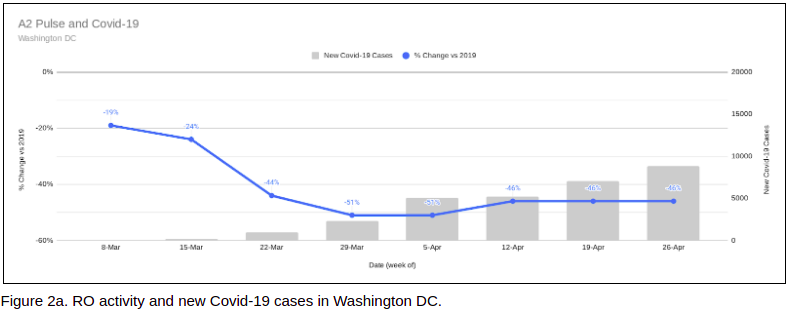
For example, among Washington DC, San Francisco and Boston, the three markets down most relative to 2019 RO activity, there are stark differences in terms of confirmed Covid-19 cases. In April, new weekly case counts averaged approximately 6.6k in Washington DC, 1.2k in San Francisco and 12.2k in Boston (See Figure 2a, 2b and 2c).
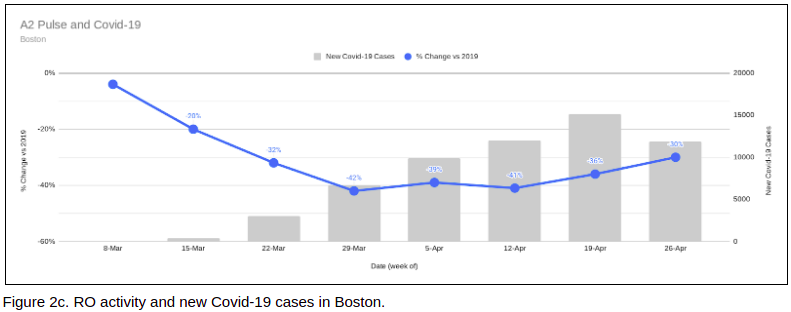
Since these three cities have comparable populations it does not seem that increases in new cases are deterring visits to auto repair shops. Government restrictions at the local or State level may be a stronger contributing factor as the differences in opinion regarding when and how to reopen have become politicized. A deeper dive into individual markets may shed light on other contributing factors.
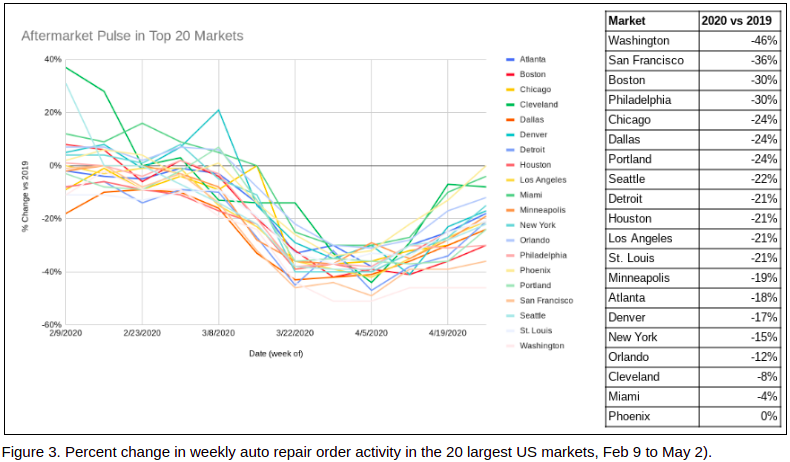
Looking at a market-by-market breakdown, the variability in RO activity remains fairly pronounced. Washington DC has passed San Francisco with the sharpest decline in RO activity vs 2020. San Francisco remains down 36% with Boston and Philadelphia not too far behind. Surprisingly, Phoenix has recovered completely versus 2019 despite being down over 30% in early April. Percent change figures for the week of April 26 to May 2 are shown in Figure 3.
Forecast
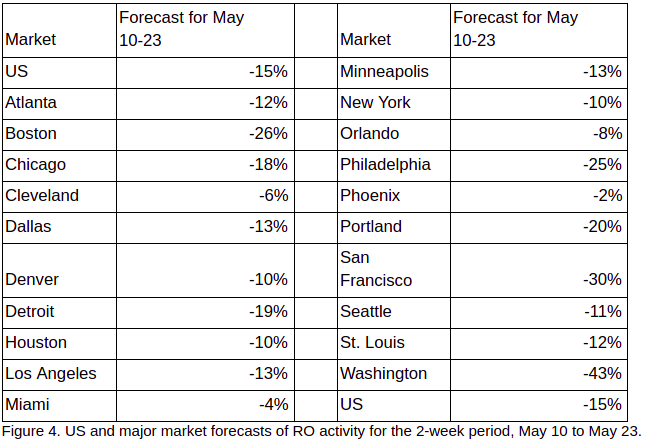
This trough and early recovery pattern trend seems to apply consistently across the major US markets. We expect this upward trend to continue through the third week of May with all markets continuing to gradually improve but still down 15% overall versus last year. The forecast table below shows each of the 20 major markets and our forecast of likely RO activity versus the same time period in 2019 (see Figure 4).
We hope these initial forecasts prove useful. If not, how could they be improved to better serve your organization? Please send us any and all feedback you’re willing to share.
Conclusion
If you have questions about this white paper or if you would like to learn how these data analytics could be customized to help your business, please contact Shawn or Richard (see below) for more information.
For more information, please contact us:
Shawn Wills, Dir. National Accounts, Email: [email protected] Cell: 303-956-2848
Richard Bernstein, VP Business Development, Email: [email protected] Cell: 847-707-8450